

Very early command sub-indicator surgers, 2026
Apr 25 2026
It's still risky to put significant stock into early-season skills, especially aggregate measures like strikeouts and walks. But looking into the components that drive them can be a helpful early-season exercise, since they represent larger sample sizes.
These starting pitchers have increased their swinging strike rates the most from 2025 to 2026 (min 20 IP each season):
| 2025 | 2026 | Δ | ||||||||
| Name | Lg | SwK% | FpK% | Ball% | SwK% | FpK% | Ball% | SwK% | FpK% | Ball% |
| Randy Vásquez | NL | 6.5% | 61% | 36% | 13.3% | 61% | 36% | 6.8% | 0% | -1% |
| Cameron Schlittler | AL | 11.1% | 63% | 34% | 16.5% | 69% | 29% | 5.4% | 6% | -5% |
| Jack Leiter | AL | 10.6% | 59% | 37% | 14.6% | 55% | 36% | 4.0% | -3% | -1% |
| Jacob Misiorowski | NL | 13.1% | 59% | 34% | 15.9% | 60% | 37% | 2.8% | 2% | 3% |
| Shota Imanaga | NL | 11.9% | 63% | 32% | 14.6% | 57% | 35% | 2.7% | -5% | 2% |
| Sandy Alcantara | NL | 9.3% | 63% | 34% | 11.8% | 64% | 35% | 2.5% | 1% | 1% |
| Max Meyer | NL | 11.9% | 63% | 36% | 14.4% | 64% | 34% | |||
Almost!
You’re just a few clicks away from accessing this feature and hundreds more throughout the year that have a singular goal in mind: Winning your league. Subscribe to BaseballHQ.com here!
Already a subscriber? Sign in here
More From Starting Pitchers
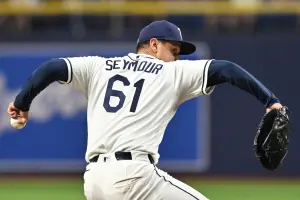
Ian Seymour's recent skill surge and transition back to a starting role give him significant appeal again in deep leagues.
Jul 18 2026 3:07am
Jul 18 2026 3:07am

No starting pitcher has provided more value in wins and innings or shown a steeper groundball tilt than Cristopher Sanchez over the past 12 months.
Jul 11 2026 3:05am
Jul 11 2026 3:05am
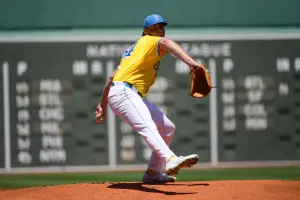
Jake Bennett's intriguing pitch profile translated well from Triple-A to the Red Sox in June, making him a premium speculation in deeper leagues.
Jul 4 2026 3:07am
Jul 4 2026 3:07am
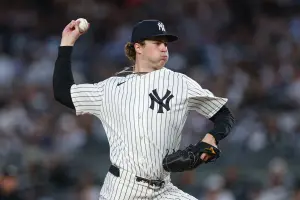
Cam Schlittler's breakthrough season would get even better if he could improve his third-time-through lineup skills.
Jun 27 2026 3:10am
Jun 27 2026 3:10am
Ben Brown gets dialed in with runners on base. Finding a similar approach with the bases empty will help him take a sustained step forward.
Jun 20 2026 3:05am
Jun 20 2026 3:05am

